Before you compare two countries, check the year attached to each number.
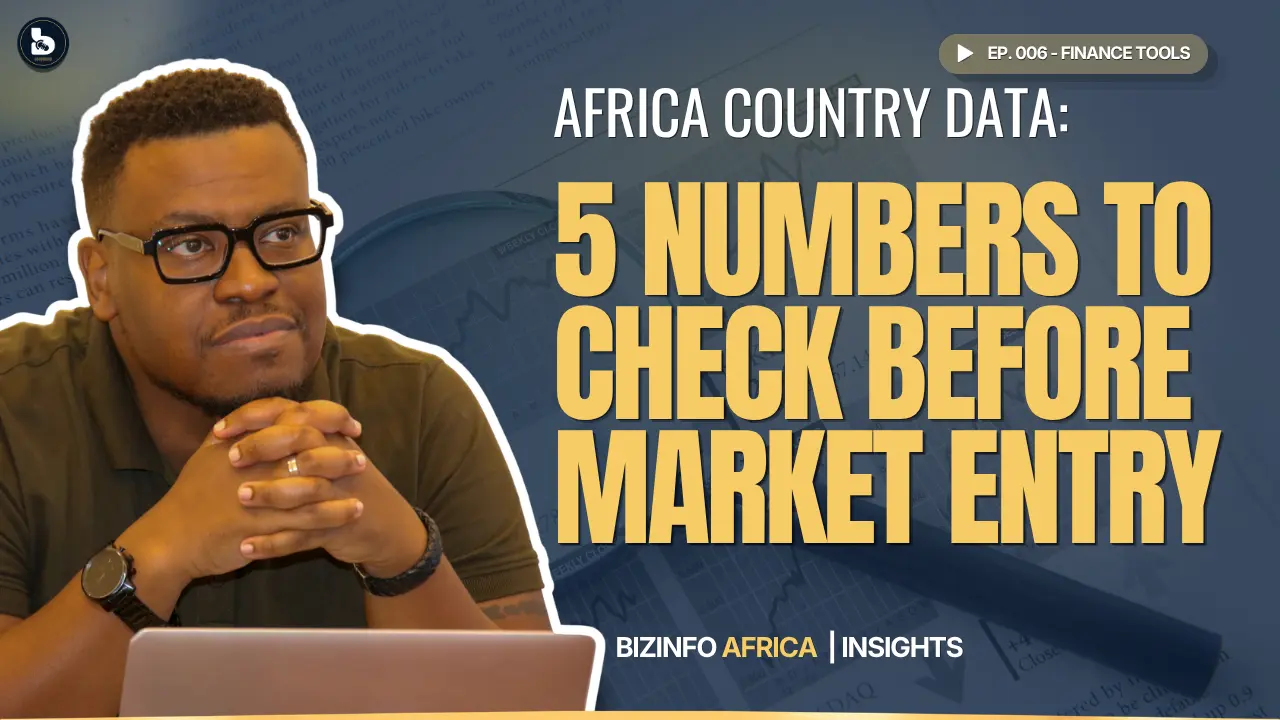
A useful first-pass African market screen combines a small set of comparable indicators with the year and source attached to each number. GDP, growth, inflation and population can show scale and context, while AfCFTA status adds a dated trade-policy signal. These indicators screen a market. They do not replace sector research, competitor analysis or counterparty due diligence.
The Africa Intelligence Map covers all 54 African countries and shows World Bank figures with year stamps.[1] A number without its year can mislead you: one country may show a recent inflation figure beside an older GDP or growth observation, which is fine for screening but not for pretending the indicators describe one period. Read GDP, growth, inflation and population together. GDP gives scale, growth gives direction for the period measured, inflation affects purchasing power and costs, and population gives demographic scale. None of them is enough alone.
Dated facts, including the trade rules
AfCFTA status carries a date too. The count reached 50 of 54 on 4 September 2026,[3] and it will keep changing, so any chart or post that uses it should carry the source date. Ratification shows the trade-policy environment, not whether your product qualifies, and that needs separate checking.[2]
Treat the map as a screen, not a decision. A market with strong macro numbers can still have weak demand for your product, difficult regulation, unreliable logistics or concentrated counterparty risk. This is the due diligence habit: use the cheap screen to shortlist, then spend your effort where the exposure is.
A sensible order: shortlist markets with the map, test your own readiness with the AfCFTA Export Readiness Index, then investigate any material counterparty with a verified evaluation.
Screen the market first. Then test the transaction and the counterparty.
Request your verified reportExplore the toolsCommon questions
How do you compare African markets?
Start with a consistent set of indicators, attach the source and year to every figure, then add sector, competitive, regulatory, logistics and counterparty research.
What economic indicators should I check before entering an African market?
GDP, growth, inflation and population can provide a quick macro screen. Trade, FX, sector demand, logistics and regulatory data are needed before making an entry decision.
Why does the year matter when comparing country data?
Because indicators from different years may describe different economic conditions. A number without its reference year can create a false comparison.
How current is African market data?
It depends on the indicator. The map displays year stamps so users can see when the underlying figure was reported or measured.
How can AfCFTA status affect market research?
It can indicate the trade-policy environment, but current implementation, product eligibility and documentation still need separate checking.
Sources
- Primary data World Bank World Development Indicators
- Primary institutional source AfCFTA Secretariat
- Specialist tracker tralac AfCFTA status, September 2026
- Primary platform BizInfo Africa, Africa Intelligence Map
Sources and figures checked 2 October 2026. Verification services by ASAP Information Services Ltd.